Investors must make informed decisions when buying and selling stocks. Understanding what a company does and how well they do it are critical to being a successful investor. Fortunately, there are two types of information available to the public: fundamental and technical analysis. Investors often ask which is better, a fundamental analysis vs technical analysis. But the answer is, every investor should be knowledgeable about both in order to protect and grow their wealth.
There are two types of Fundamental Analysis, qualitative and quantitative.
Qualitative analysis focuses on the quality of the company’s management, corporate image, comparative advantages and product. These are subjective in nature and are based in personal and public opinion.
Quantitative analysis measures existing financial results – past and present – to gauge the current status of a company and to predict its future performance. These underlying data points are found in the financial statements within the annual and quarterly earnings reports and periodic filings with the SEC.
The primary components of Fundamental Analysis are
Together with these economic results, several financial ratios are calculated to measure fiscal health:
Each financial statement provides a snapshot of the company at a specific time. However, a study of the various financial results and ratios over multiple time periods provides a detailed and more complete portrait of the company’s overall trends and economic direction.
This fundamental foundation of knowledge enables investors to accurately measure the financial condition of a company and buy or sell with confidence.
When evaluating whether to use a Fundamental vs Technical analysis, it’s important to understand where each source their information. In Fundamental Analysis, the information needed comes from the company. When investors apply Technical Analysis, however, the information comes from the market.
The foundation of Technical Analysis is that the market is the best gatherer and interpreter of all the available information, whether from company reports, industry changes or macro-economic factors. And all that information is constantly reflected in the company’s stock price and the volume of shares traded.
In other words, the price action of a stock is the end-result of all the information, analysis and forecasts of the various investors buying and selling a particular stock at that current moment. Basically, technical analysts see stock price and volume as all the information necessary to invest.
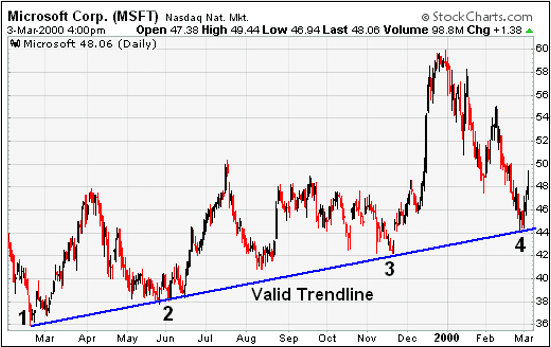
As stock price and volume are the main inputs, Technical Analysis is often displayed visually in charts. The most basic chart is a line chart which simply plots the closing price of a stock over time. Another is the bar chart which provides the high price and the low price (the body or length of the bar) and the closing price.
Similar to Fundamental Analysis, a chart depicting a single day’s trading provides minimal information; but, when utilizing a longer time horizon, patterns emerge that follow certain trading trends (known as trendlines) and probable future trends.
Besides bar charts and trendlines, there are numerous other technical indicators and analyses focusing on the various aspects of price and volume.
These technical indicators predominantly measure shifts in:
Each of these specific, logic-based systems signal a stock price change or continuation and gauge whether a stock may be undervalued or overvalued.
Recent technology advancements and robust computerization have also dramatically increased the quantity and statistical sophistication of technical analytics. They can seem overwhelming and overly complex.
As with statistics in general, an investor can find a technical indicator that will support their bias. This noise and abundance of choices can lead to faulty analysis and bad investment decisions. Investors should match their technical tools with their level of knowledge. Conversely, understandable and straightforward technical indicators are useful tool for investors managing and growing their portfolio.
As we have seen, Fundamental Analysis deciphers past and current financial data to forecast future results. Technical Analysis also utilizes the past to predict the future, but solely focuses on price and volume.
While investors can be rewarded using only fundamental or technical information, that limits the information possible to make an informed decision.
Both are necessary. But when is one better than the other? Simply put, when determining to use a fundamental vs technical analysis, Fundamental Analysis is most effective determining long-term potential and outlooks, while Technical Analysis is better for short-term movements and changes.
The majority of fundamental data is provided quarterly and annually. But stock prices are daily. That means that technical indicators may also shift daily, or even intraday! Often a technical indicator may signal a buy or sell, which is eventually verified by the fundamentals.
Neither analysis is meaningful, however, unless they are predictive. The key to successful investing is to determine where prices will be, not where they have been.
An effective system to evaluate future performance is a combination. Investors should utilize fundamental criteria (such as historical earnings growth, profit margins and sales) to identify appropriate securities to invest in. Once identified, the investor should look to various technical indicators (trendlines, over/under valuation, volume) to pinpoint the best time to buy or sell. At their core, Fundamental Analysis is about the “what,” and Technical Analysis is about the “when.”
In Summary:
Today investors are dealing with instant and constant information. This can make it difficult to choose where and when to invest. Fortunately, there are two methods available to unlock value: Fundamental and Technical Analyses. Both have merit and investors need to understand and utilize both to manage their portfolios and grow their wealth.
Wealthplicity Recent Posts