When using Technical Analysis to evaluate stocks, investors focus primarily upon price and volume. However, in derivative securities, such as options and futures, another piece of information is available – open interest.
Open interest (OI) is not the same as volume; it is the total number of an options or futures contract that have not been closed out by settlement or expiration; it is basically the number of contracts that exist for a particular stock (options) or index/commodity (futures).
When an option or futures position is initiated – bought or sold – it is considered “open”. That position is considered “closed” when 1) the initiating buyer or seller reverses the position, or 2) the position expires. Open interest measures the number of open positions and is totaled at the end of the day. Volume measures the real-time number of contracts traded during the day. OI can be considered a gauge of money flows and expectations, with volume describing trading activity. Both sets of data are useful to help investors determine trend confirmations and reversals.
As they come to the market, through IPOs, SPACs or direct offerings, companies establish a defined number of shares available for trading. These are known as a stock’s outstanding shares. Unlike the underlying stock, however, there is no limit to the number of option contracts that may be created. As long as there is demand and supply – buyers and sellers – the amount of open option positions can increase unrestricted.
A high OI number means there is a large amount of interest in that particular option strike price and expiration. It can be bullish or bearish, which can be possibly inferred from the stock price action. A large open interest also signals a healthy level of liquidity for that contract, which reduces the market impact and cost – ease of entry and affordability – to establish (open) an options position.
When you learn how to trade options, taking the time to understand what drives a stock price goes a long way to a successful trade. OI is just one of the variables that could help you increase your option investment’s profitability.
In order to understand what OI indicates, investors need to understand the actual mechanics. Open interest only rises when new positions are initiated. Conversely, it falls when positions are closed. And when a new buyer (or seller) purchases from an existing seller (or sells to an existing buyer), the OI number does not change.
For example, when Investor A buys 5 call options as a new position from a new seller Investor B, the OI increases by 5 – the number of new contracts established. If Investor A sells those 5 contracts back to Investor B, closing both positions, OI declines by 5. And if Investor A buys 5 new contracts from Investor C who already owns those 5 contracts, the opening purchase is offset by the closing sale and OI remains the same.
Thus, OI rises when new money – long or short – enters the market (positions are opened) and declines as money leaves the market (positions closed). It indicates the level of enthusiasm by new investors for that particular option contract.
By itself open interest tells investors little. But paying attention to its changes can provide useful clues to potential trend reversals or confirmations. A simple reference guide that considers the contract price, volume and open interest is helpful to interpret OI movements:
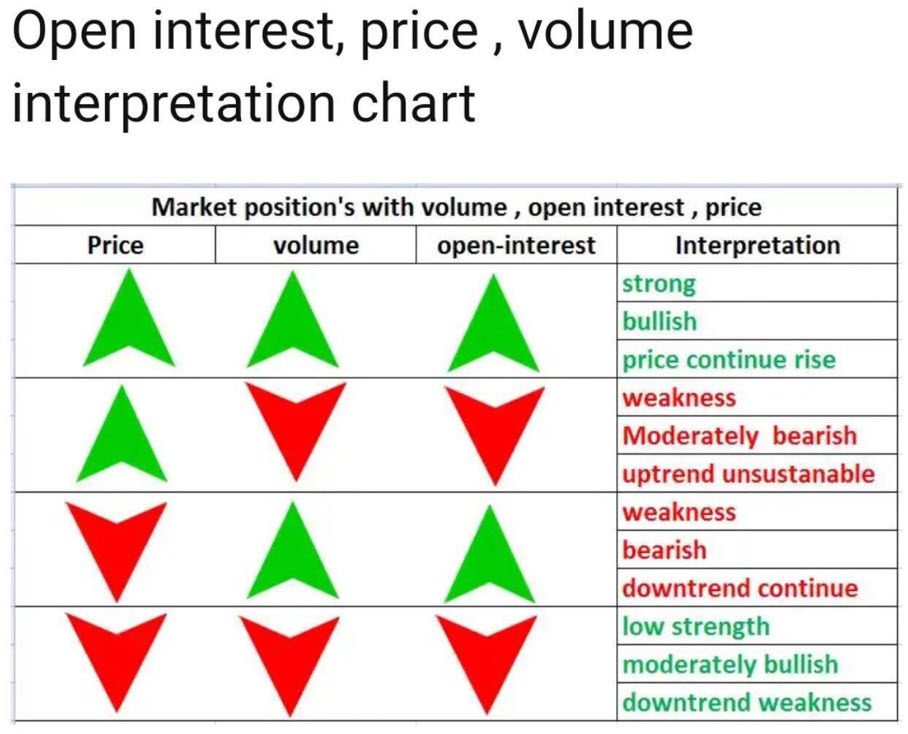
The first and third row directions confirm existing up and down trends, with the second and fourth rows signaling potential up trend and down trend reversals, respectively. In these instances, OI acts like a Momentum Indicator, which are most useful when analyzing a change in their level to signal potential trend reversals and overbought/oversold conditions, similar to a moving average oscillator:
It is these changes in open interest trends that provides investors with predictive capabilities.
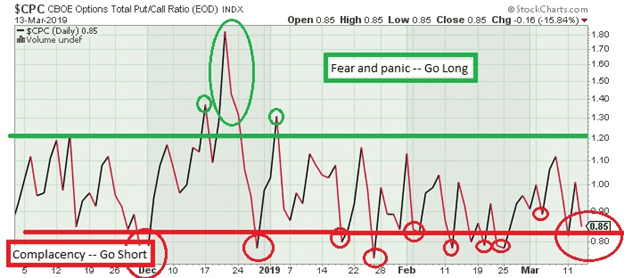
Another use of open interest is in the aggregate OI Put/Call Ratio. This is a Sentiment Indicator that points to the overall mood of the market. It divides the total open interest of all the puts of an index by all the calls. Results greater than 1 indicate more put open interest than call open interest, which would be considered bearish. Conversely, a ratio below 1 is bullish as there is more call open interest. However, a static reading is not very helpful. Investors must monitor the ratio looking for reversals from extreme levels in order to predict a trend change in the market.
In Summary
Open interest provides a measure of both the liquidity and the overall money flow into a specific option or futures. While it may be overlooked by some, savvy investors will pay attention to OI levels to confirm existing price movements and continued momentum, or to anticipate a trend reversal from extreme sentiment levels. It is a valuable tool for investors utilizing options in their pursuit of wealth creation.
Wealthplicity Recent Posts