Investors seeking returns should utilize a blend of Fundamental and Technical Analyses to identify worthy investments. On the Technical side, there are multiple tools and indicators available. Among these are Bar Charts, Momentum indicators and Volume indicators which display overbought/oversold conditions, existing trends and potential inflection points of individual stocks and indices. However, there are also helpful metrics that look at the status of the overall market. These are called Market or Index Indicators. Some of the most popular Index Indicators found in most financial information websites and publications are:
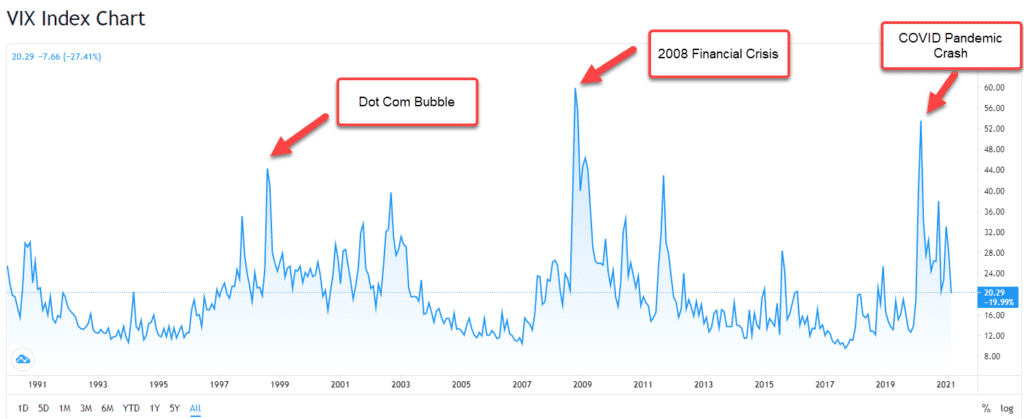
The Volatility Index (VIX) is a measure of the expected volatility of the S&P 500 Index over the next thirty days. It considers the market prices of the near-term call and put options on the S&P 500 Index and their variance to risk-free U.S. Treasury bill rates. Basically, it measures the probability of a forceful change in the direction of the index.
The VIX is also known as the “fear index” as since its inception around 1990 the primary spikes in value have been during sudden and violent down markets. This makes sense as the prices (or premiums) of index long puts rally dramatically during sharp selloffs.
In the Financial Crisis of 2008, the VIX traded above 80, as it did at the height of the pandemic fears in March of 2020. As with other technical indicators, extreme levels point to opportunities: below 12 the VIX signals a market too complacent and potentially ready for a reversal; conversely, spikes historically above 35 portray a nervous market (usually) presenting a buying opportunity.
Unfortunately, despite the quantity of press it receives, the VIX is more of a coincident indicator than a leading indicator. It does provide information at its extremes, but investors should not rely upon the VIX only to make decisions.
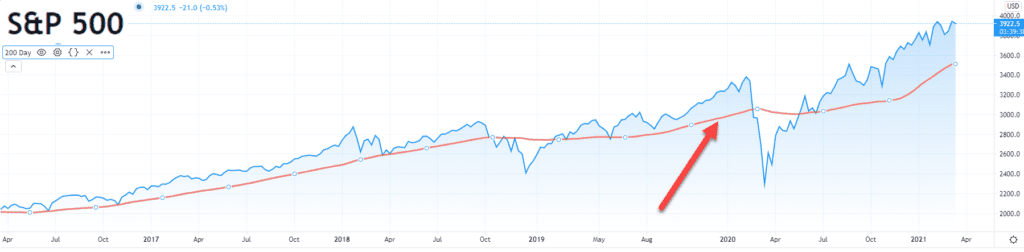
The simplest Market or Index Indicator is the 200 Day Moving Average (200 MA). It is an easy snapshot of the prevailing trend of any index. The 200 MA is especially useful as its length eliminates the noise and emotions of short-term volatility and allows investors to maintain focus upon a long-term perspective.
This longer outlook and the awareness of the overall market direction prevents investors from over-trading and incorrectly initiating or exiting positions. Investors also effectively utilize the 200 MA as either a support or resistance level, depending on whether a bull or bear market, respectively.
A penetration of the 200 MA in either direction is a warning signal that the trend may be reversing. Also, a crossover by the index, coupled with an eventual turn in the 200 MA is a solid – albeit lagging – confirmation of a trend reversal. Investors adding a shorter-term MA, say a 50 or 65 day, can observe earlier signs of a potential sea change in the market when the short-term moving average crosses the 200 MA.
If investors could only use one Index Indicator, it would be the 200 Day Moving Average. Its simple yet profound indication of market direction while signaling potential shifts make the 200 MA a valuable and consistent technical tool.
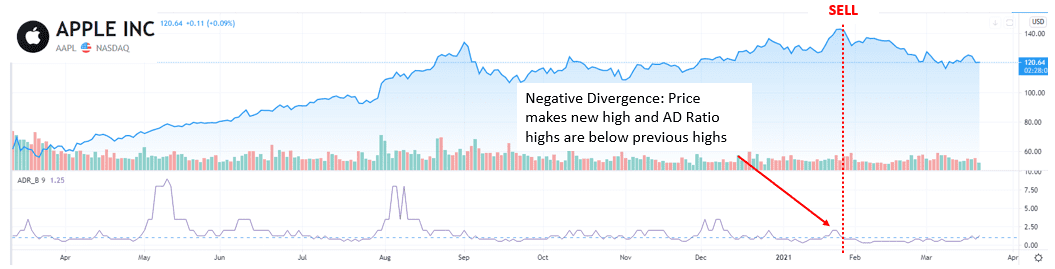
The Advance/Decline Line (A/D) is the cumulative net of the number of advancing stocks (stock whose closing price is above its previous close) less the number of declining stocks. Investors may also use A/D volume, subtracting the volume of the stocks that traded down on the day from the volumes of up stocks.
Either is an effective gauge of the market breadth, or how broad-based is a market move. As indices are capitalization-weighted, a price move by a select few key large cap stocks may have a disproportionate impact. Thus, a measure of the entire index without regard to size is beneficial to understand the full range and depth of a market move.
The A/D, similar to other technical tools, helps confirm current trends – rising during up moves, falling during down moves – or looks for divergence from the current trend to indicate a reversal may be coming.
The Arms Index was developed in 1967 by Richard Arms. Also called the TRIN (for TRading INdex), it is a breadth indicator based upon the A/D line and A/D volumes. It is the ratio of the number of advances to declines divided by the ratio of advancing volume to declining volume.
Numbers below 1 signal a strong market as that means that advancing volume is stronger than declining volume, which is necessary to sustain rallies. Likewise, numbers above 1 demonstrate weak volume, which would portray an unsustainable move.
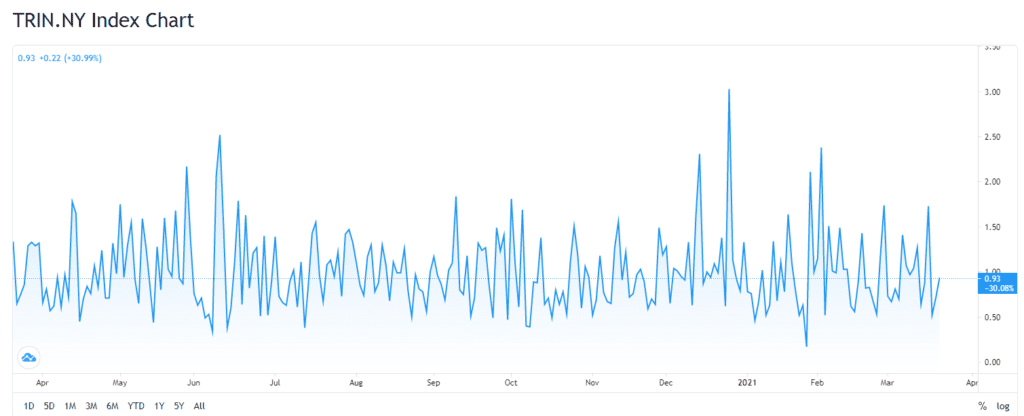
The TRIN is fairly volatile, pointing to short-term market tops and bottoms. However, a moving average may be utilized to smooth the data and indicate longer-term overbought and oversold conditions.
Again, similar to the A/D, the TRIN captures for investors the true breadth and sustainability of a market move.
The New Highs/New Lows is another breadth indicator that measures the overall strength or weakness of the market. It comprises the number of stocks whose closing price makes a new 52 week high less those making a new 52 week low.
A strong market will have a large and increasing number of new highs. A weak market will have a growing number of new lows. Again, a divergence will be a red flag indicating the underlying strength or weakness is not in tandem with the price move.
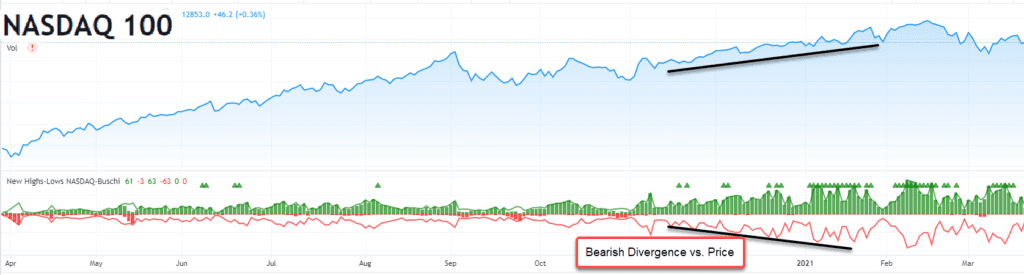
A moving average of the New High/New Low Differential (New Highs less New Lows) is also utilized to visually depict divergences and overbought/oversold conditions.
In Summary
There are many tools in the Technical Analysis toolbox. Some are straightforward. Others are esoteric and complex. Investors must match their tools with their investment knowledge. Index Indicators, however, are essential to both novice and sophisticated investors. The basic awareness of the overall trend of a market and its underlying strength or weakness is invaluable to all investors. From that knowledge all other investment decisions follow.
Wealthplicity Recent Posts